Tutorials
Electrostatic Potential I
Electrostatic Potential Tutorial
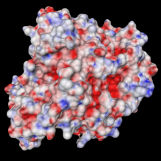
This tutorial will quickly walk you through the generation and visualization of the electrostatic potential on the surface of acetylcholine-esterase (ach.pdb from 1B41). Please note that the generated potential is mainly determined by your dielectric constants (epsilon values) and the charges assigned to your protein atoms. These factors will not be discussed here.
I Calculate the molecular surface of your protein with MSMS:
pdb2xyzr ach.pdb > ach.xyzr
msms -if ach.xyzr -of ach -d 2
(yielding ach.vert and ach.face)
II Add hydrogens to your structure (e.g. with the generate_easy script from CNS) (not shown), yielding ach_h.pdb.
III Use MEAD to calculate the ESP:
Assign radii and charges to your coordinates (replacing the occupancy and bfactor columns):
assign_parse_radch.pl < ach_h.pdb > ach.pqr
Prepare a parameter file called ach.ogm containing one line:
ON_GEOM_CENT 121 1.0
Then calculate the potential:
potential -epsin 4 -ionicstr 10.0 -CoarseFieldOut ach ach
IV Visualize everything in DINO:
Download this script: esp.scr
// adjut these to fit your desired range set neg -0.02 set pos 0.02 load ach_h.pdb -name p load ach -type msms -name s load ach.fld -name e .p new -name all .s new -name all .s.all set color=red -range src=.e,val=-9999:$neg .s.all set color=red:white -range src=.e,val=$neg:0.0 .s.all set color=white:blue -range src=.e,val=0.0:$pos .s.all set color=blue -range src=.e,val=$pos:9999 |
